Week of June 22, 2026

Published every Monday: Get a detailed snapshot of what moved the markets last week—and what to watch this week.

The tension between optimism and reality.

Investor enthusiasm over the memorandum of understanding (MOU) to end the war between the U.S. and Iran sent stocks higher. The Federal Reserve (Fed), however, made it clear that it remains focused on bringing inflation down and could raise rates later this year, which capped weekly gains.

Weekly Quick Hits

Beyond the Headlines

The tension between optimism and reality.

Report Releases

The Fed held interest rates steady and reiterated its focus on reducing inflation.

Financial Market Data

Stocks were broadly higher, led by the technology-heavy Nasdaq Composite.

Looking Ahead

Income and spending data and Micron earnings are in focus.

BEYOND THE HEADLINES:

The tension between optimism and reality.

After last weekend’s announcement of a potential deal between the U.S. and Iran to end the war in the Middle East, markets rallied and oil prices dropped. This reaction made sense, given that higher oil prices contributed to inflation pressure. On Wednesday, however, the Fed concluded its June meeting with inflation still very much on its radar. These competing forces will play a significant role in stock and bond performance this year.

Negotiations to End the War Have Begun
Investors have been focused on the announcement that the U.S. and Iran reached the MOU to end the war in the Middle East. Now that the memorandum has been signed, negotiations have begun. The parties have 60 days to sign a final deal.

Investors quickly discounted what many viewed as the removal of the market’s biggest risk. The prospect of higher oil prices accelerating inflation was a concern for investors against an otherwise positive backdrop of strong corporate earnings growth. That concern stemmed from worries that the Fed would raise rates to fight inflation. Rate hikes became more likely as the labor market stabilized over the past three months and consumer and producer price inflation rose more than 4 percent and 6 percent year-over-year, respectively.

The Fed’s Reality
Kevin Warsh presided over his first meeting as Fed chair on Wednesday. The statement afterward and Warsh’s news conference made it clear that the central bank remains focused on inflation—no matter what oil prices have done over the past several weeks. Warsh noted that the Fed will deliver price stability and that there has been no change to its 2 percent inflation target. Investors viewed that as a hawkish shift for the central bank, and most market participants now believe the Fed will raise rates in September.

From the market’s perspective, the critical piece of the MOU is the reopening of the Strait of Hormuz. If it reopens within 30 days and returns to full capacity, oil prices are unlikely to be a continuing risk, though it will certainly take time for consumer and producer prices to return to more normal levels. If there is evidence that price pressures are easing, however, perhaps the Fed would be willing to look through recent inflation when considering whether to raise interest rates by the end of the year. In that case, the reaction to Warsh’s first news conference could be overdone.

A Supportive Backdrop
Second-quarter corporate earnings season begins soon. The bar has been raised, with analysts expecting almost 22 percent earnings growth for the S&P 500. Although this raises the risk of too much optimism around corporate America, that concern has proven to be unfounded over the past five quarters. If companies continue to deliver strong growth, the market should be supported over the long term—no matter what volatility might occur in the short term.  


“The prospect of higher oil prices accelerating inflation was a concern for investors against an otherwise positive backdrop of strong corporate earnings growth. 

Report Releases: June 15–18, 2026

Housing starts and building permits

Housing Starts and Building Permits:
May (Tuesday)

Housing starts fell more than 15 percent last month, well below expectations, bringing the pace of new home construction to its slowest level since 2020.

  • Expected/prior housing starts: –2.0%/–8.5%
  • Actual housing starts: –15.4%
  • Expected/prior building permits: –0.9%/+4.5%
  • Actual building permits: –0.7%
Retail Sales

Retail Sales:
May (Wednesday)

Retail sales growth beat expectations last month. Although some of the improvement may be due to larger tax refunds this year, it remains an encouraging economic sign given the importance of consumer spending.

  • Expected/prior monthly change in retail sales: +0.6%/+0.4%
  • Actual monthly change in retail sales: +0.9%

Federal Open Market Committee (FOMC) Rate Decision:
June (Wednesday)

As widely expected, the Fed left interest rates unchanged after its June meeting. The post-meeting statement and Warsh’s news conference, however, were viewed as hawkish by investors.

  • Expected/prior federal funds rate upper limit: 3.75%/3.75%
  • Actual federal funds rate upper limit: 3.75%
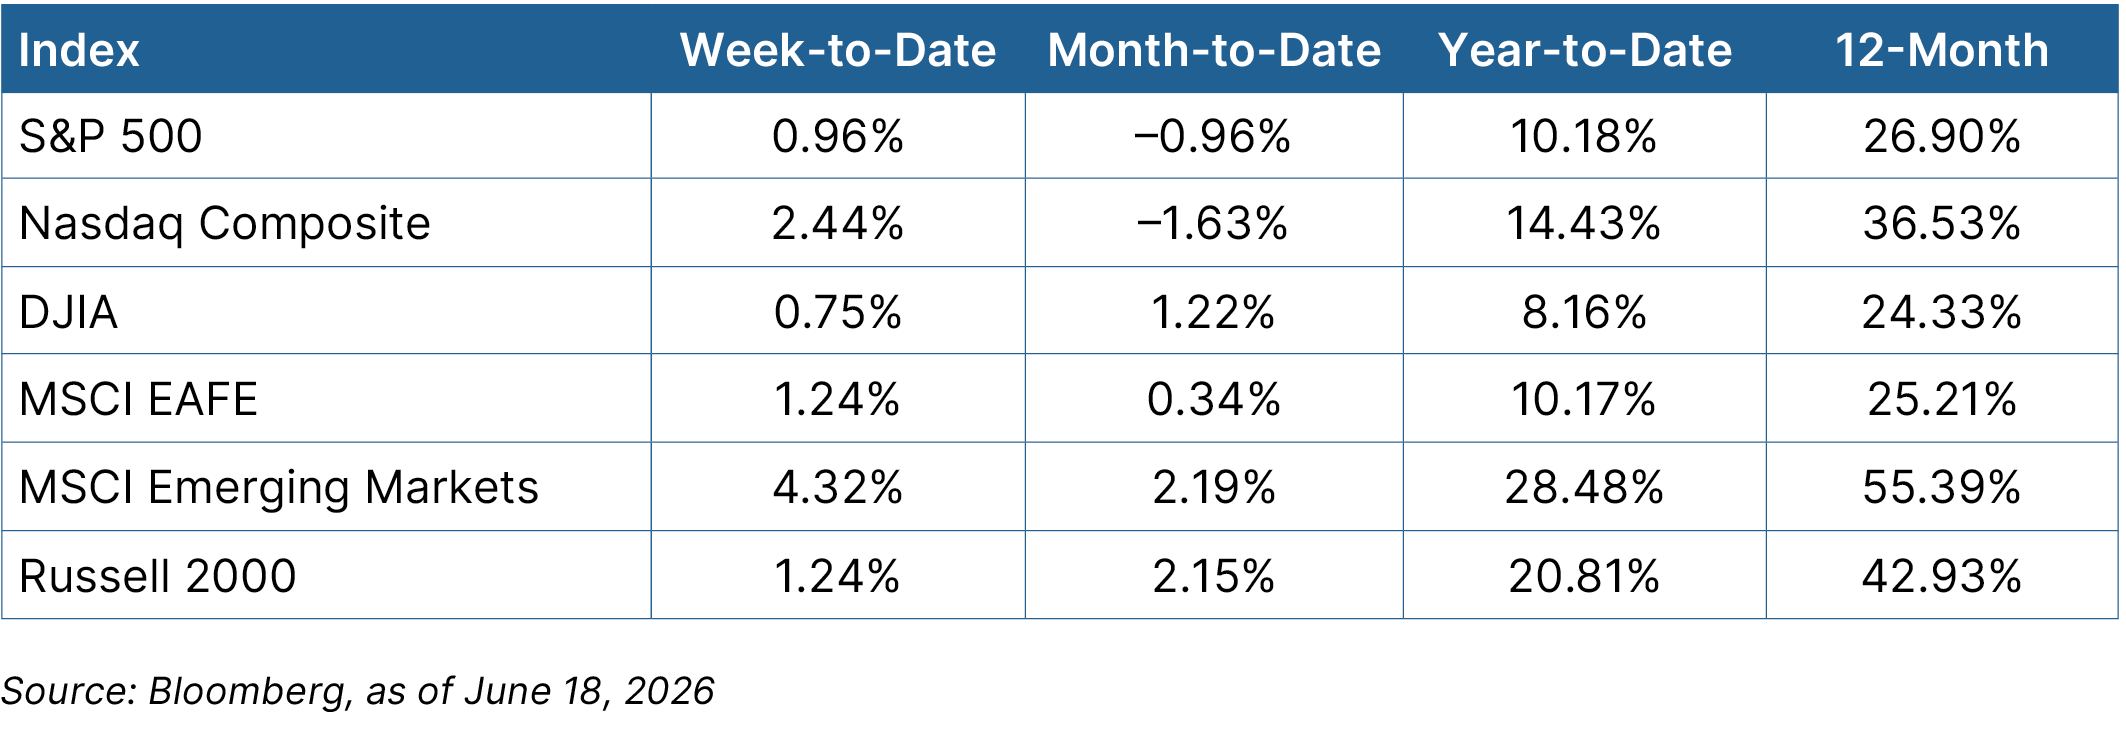

The Takeaway


  • Although housing starts declined sharply, retail sales again exceeded expectations.
  • The Fed made it clear that it remains focused on reducing inflation and will consider raising interest rates this year.

Financial Market Data

Equity

The signed MOU between the U.S. and Iran helped drive markets higher. The technology-heavy Nasdaq Composite led the way, rising 2.44 percent. From a sector perspective, technology and industrials each rose nearly 3 percent. With the Strait of Hormuz poised to reopen and oil prices declining more than 10 percent, energy fell 6.5 percent. Real estate, health care, and consumer staples each sold off roughly 3 percent. International markets continued their strong performance.
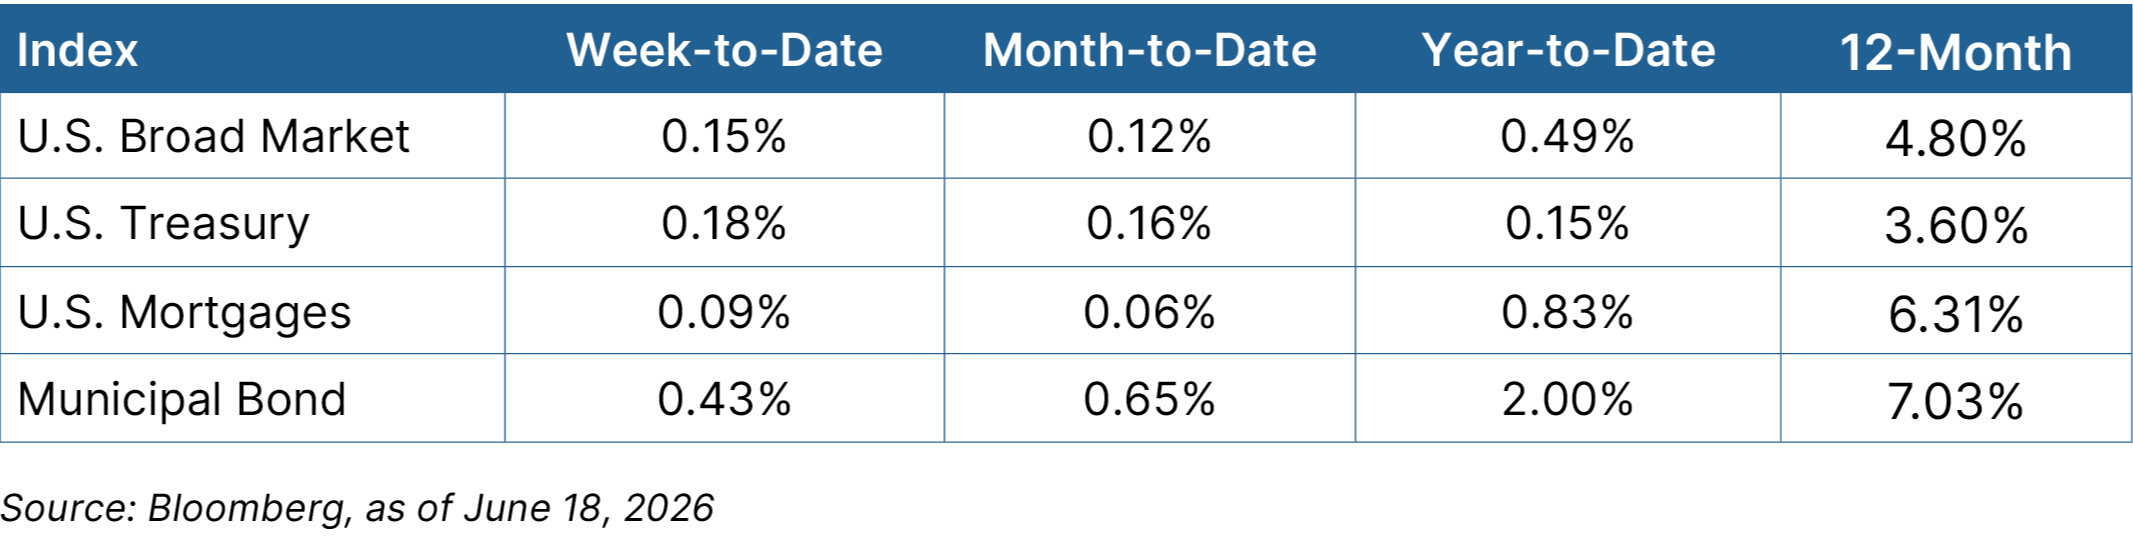
Equity graph

Fixed Income

Bond markets were up marginally despite investors interpreting the Fed’s meeting as hawkish. The central bank, which remains focused on reining in inflation, left the door open for a potential rate increase this year. Short-term Treasury yields rose, and longer-term yields declined, with the 10-year closing at 4.45 percent.

Fixed income graph

The Takeaway


  • The signing of the MOU to end the war in the Middle East sparked a stock rally. The Nasdaq led the way, rising more than 2 percent.
  • Fixed income markets were essentially flat as investors balanced the signing of the MOU with a more hawkish Fed.
Looking Ahead Image

Looking Ahead

The highlight this week will be the release of personal income and spending data for May.

  • The week kicks off on Wednesday, when Micron reports earnings for its May quarter. Micron has been a big beneficiary of the AI buildout, and investors will be focused on the outlook because the company has been one of the biggest drivers of corporate profits this year.
  • On Thursday, we’ll see the preliminary durable goods orders report for May. Orders are expected to decline sharply because of weakness in volatile transportation orders.
  • Also on Thursday, the personal income and spending report for May is expected to be released. Both data points are expected to show growth, which would represent a solid rebound after a flat April.

Disclosure: This material is intended for informational/educational purposes only and should not be construed as investment advice, a solicitation, or a recommendation to buy or sell any security or investment product. Diversification does not assure a profit or protect against loss in declining markets, and diversification cannot guarantee that any objective or goal will be achieved. Please contact your financial professional for more information specific to your situation.

Bonds are subject to availability and market conditions; some have call features that may affect income. Bond prices and yields are inversely related: when the price goes up, the yield goes down, and vice versa. Market risk is a consideration if sold or redeemed prior to maturity.

Certain sections of this commentary contain forward-looking statements that are based on our reasonable expectations, estimates, projections, and assumptions. Forward-looking statements are not guarantees of future performance and involve certain risks and uncertainties, which are difficult to predict. All indices are unmanaged and are not available for direct investment by the public. Past performance is not indicative of future results. The S&P 500 is based on the average performance of the 500 industrial stocks monitored by Standard & Poor’s. The Nasdaq Composite Index measures the performance of all issues listed in the Nasdaq Stock Market, except for rights, warrants, units, and convertible debentures. The Dow Jones Industrial Average is computed by summing the prices of the stocks of 30 large companies and then dividing that total by an adjusted value, one which has been adjusted over the years to account for the effects of stock splits on the prices of the 30 companies. Dividends are reinvested to reflect the actual performance of the underlying securities. The MSCI EAFE Index is a float-adjusted market capitalization index designed to measure developed market equity performance, excluding the U.S. and Canada. The MSCI Emerging Markets Index is a market capitalization-weighted index composed of companies representative of the market structure of 26 emerging market countries in Europe, Latin America, and the Pacific Basin. The Russell 2000® Index measures the performance of the 2,000 smallest companies in the Russell 3000® Index. The Bloomberg US Aggregate Bond Index is an unmanaged market value-weighted performance benchmark for investment-grade fixed-rate debt issues, including government, corporate, asset-backed, and mortgage-backed securities with maturities of at least one year. The U.S. Treasury Index is based on the auctions of U.S. Treasury bills, or on the U.S. Treasury’s daily yield curve. The Bloomberg US Mortgage Backed Securities (MBS) Index is an unmanaged market value-weighted index of 15- and 30-year fixed-rate securities backed by mortgage pools of the Government National Mortgage Association (GNMA), Federal National Mortgage Association (Fannie Mae), and the Federal Home Loan Mortgage Corporation (FHLMC), and balloon mortgages with fixed-rate coupons. The Bloomberg US Municipal Index includes investment-grade, tax-exempt, and fixed-rate bonds with long-term maturities (greater than 2 years) selected from issues larger than $50 million. One basis point is equal to 1/100th of 1 percent, or 0.01 percent.

Authored by the Investment Research team at Commonwealth Financial Network®.

© 2026 Commonwealth Financial Network®

Let’s Talk About Your Financial Future

Whether you’re navigating a volatile market or preparing for the future, we’re here to help.

Schedule a Consultation